Month: October 2016

  • Eye-tracking reveals the Pros in Mario Kart

    Eye-tracking reveals the Pros in Mario Kart

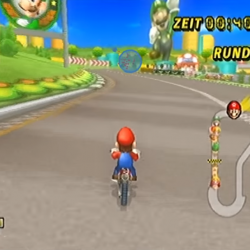
    Ever wondered how your eyes perform while playing a videogame? Turns out they might be quite important for you winning the game. Actually, so important that one can even distinguish whether you are a winner based solely on the movement of your eyes! And here is, what eye-tracking whilst gaming looks like:

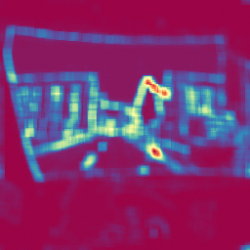
    The small blue dots are called fixations, i.e. the spots where the eye rests at (even if it does so only shortly). During a fixation we actually perceive visual information. Fixations are interconnected by saccades, very very fast movements of the eye. In fact, they are so super-fast that our brain suppresses visual perception while we perform them. Try it with a mirror – you won’t be able to see your eyes moving when you look from one spot to the other.


    Eye-tracking data comparison

    So when you do an eye-tracking experiment, the result is just a list of fixation locations (and durations) and the saccades in-between. May look fancy on youtube, but doesn’t actually tell you anything meaningful most of the time. What you need to do is calculate some key metrics (such as the average time spent looking at the same location before shifting gaze; or the gaze density at certain game objects).

    Comparing eye movement sequences to each other as a whole (without the restriction to one specific key metric) is non-trivial (and I will likely cover this in a future post, as this is my PhD topic 😉 ). But if we do so, turns out that we can separate good players from novices quite well (Figure 1). It’s not just reactions that we train and getting to know the game better – but also a training effect in the patterns of how we need to move our eyes, that make a good player.

    The percentage of eye-tracking recordings that were correctly classified as either fast or slow drivers are shown on the diagonal. Off-diagonal elements (left top and bottom right) are misclassifications.
    Figure 1: The percentage of scanpaths classified correctly as either fast or slow drivers is shown on the diagonal. Off-diagonal elements (left top and bottom right) are misclassifications.

    T. C. Kübler, C. Rothe, U. Schiefer, W. Rosenstiel, E. Kasneci (2016): SubsMatch 2.0: Scanpath comparison and classification based on subsequence frequencies. Behavior Research Methods:1-17

  • Javascript Saliency Map Webservice

    Javascript Saliency Map Webservice

    Saliency is a measure of how strong elements stand out from their surrounding. Highly salient objects are likely to attract an observer’s attention. These regions are usually viewed during the first fixations, within very few seconds or even milliseconds. Are you interested in what people will look at in your image/website/advertisement?

    Give it a try:

    Original image


    or use your own image:

    Processing progress:

    Saliency map

    Residual filter length:

    Postprocess smoothing:

    There are several ways to computationally calculate saliency and all of them somehow highlight large color and intensity contrasts in the image. Depending on which method you prefer, the calculation is inspired by the human retina and visual processing pipeline, or just a plain piece of math (less physilogically meaningful but not necessarily less accurate when it comes to predicting observer’s gaze).

    While image based saliency is an indicator of where attention will be directed to, it is entirely a bottom-up approach. That means that no knowledge of the viewer is included in the model. However, we humans have developed clever viewing strategies to tackle certain tasks, such as viewing web pages. To get a depper understanding of where we actually look at – and which cognitive associations are involved – there is currently no way around an eye-tracking study.

    All data processing in this application is client-sided, meaning that neither your image nor the generated saliency map is transferred to any computer but yours.
    Some remarks: The above saliency map computation works on gray-scale images. Even if you provide a color image, the implementation will convert it to grayscale. Theoretically, one could (and should) combine multiple saliency maps computed on different color spaces to get better results.


    Hou, Xiaodi and Zhang, Liqing (2007): Saliency detection: A spectral residual approach. 2007 IEEE Conference on Computer Vision and Pattern Recognition:1-8

    Map colors based on www.ColorBrewer.org, by Cynthia A. Brewer, Penn State.
    Fourier Transform in Javascript by Anthony Liu.